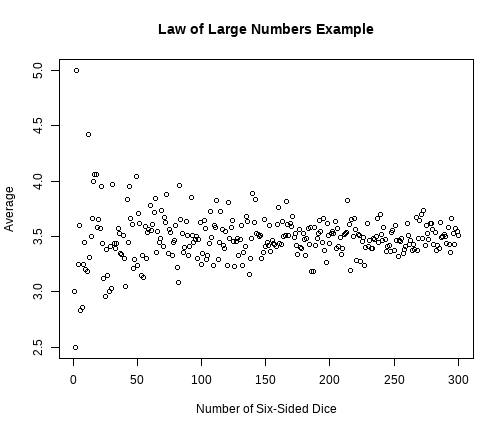
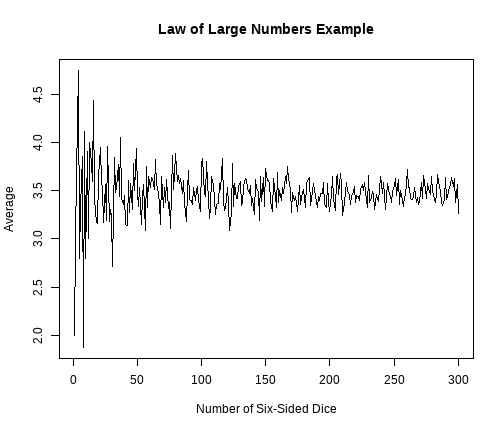
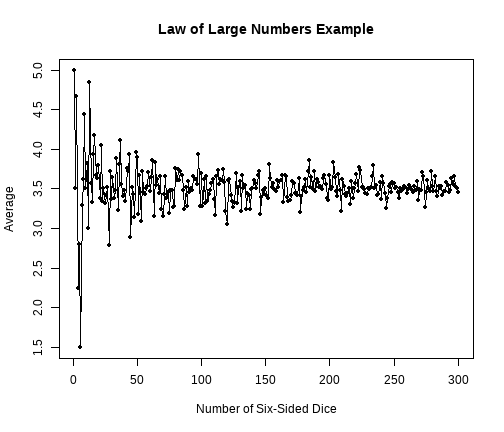
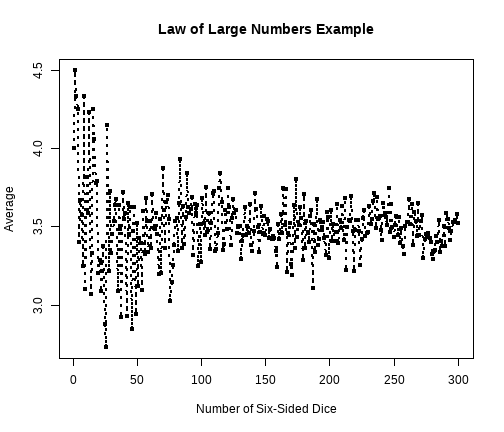
class: center, middle, inverse, title-slide # STATS 250 Lab 06 ## Simulation ### Nick Seewald<br />nseewald@umich.edu ### Week of 10/05/2020 --- class: center middle # Reminders 💡 Your tasks for the week running Friday 10/2 - Friday 10/9: | Task | Due Date | Submission | |:-----|:---------|:-----------| | M-Write 1 Final Revision | Wednesday 10/7| Canvas | | Homework 5 | Friday 10/9 8AM ET | course.work | | Lab 5 | Friday 10/9 8AM ET | Canvas | Stop by office hours! You can attend anyone's -- not just mine! M-Write office hours schedule on Canvas (see MWrite Info on home page) --- # Homework 4 Comments - Statistics is not a branch of math. It is a *mathematical science*. - In statistics, it's important that we tie our conclusions back to data. -- - **context context context context context** -- - *ALWAYS* put your answer back into the context of the problem. - What does `\(R^2\)` mean in *this* situation? - Why is regression useful to address *this* question? <div style="text-align:center;"><img src="https://media.tenor.com/images/1ab88a521fc0da50d609e14eda65c2aa/tenor.gif" width=500 ></img></div> --- # Learning Objectives .pull-left[ ### Statistical Learning Objectives 1. Explore sample-to-sample variation 1. Investigate probability using long-run proportions ] .pull-right[ ### R Learning Objectives 1. Learn about reproducible randomness by "setting seeds" 1. Functions within functions: `table(sample())` 1. Line plots in R ] --- # Weekly Advice - Randomness is **random**: your mileage may vary when you run code inside chunks. - Check your HTML file before submitting it! You'll notice formatting issues you can easily fix (often by adding blank lines to your Rmd file). -- .pull-left[ Please try to follow along with this video. **It will help.** ] .pull-right[ <br> <div style="text-align:center;"><img src="https://media1.tenor.com/images/b79c5979e1617eb62ac810eb6d5f6cda/tenor.gif?itemid=16115882" height=300></img></div> ] --- # Vectors (again) A *character* vector is a vector where the elements are "strings" of text. ```r x <- c("hi", "this is", "a character vector.", "Are you impressed?") x ``` ``` [1] "hi" "this is" "a character vector." [4] "Are you impressed?" ``` Again, note the use of the `c()` function. -- <div style="text-align:center;"><img src="https://media.tenor.com/images/bafdff17d50e713ddee90192206ec318/tenor.gif" height=200></img></div> --- # `rep()` What's easier to code? ```r pets <- c("cat", "cat", "cat", "cat") pets ``` ``` [1] "cat" "cat" "cat" "cat" ``` -- ```r cats <- rep("cat", 4) cats ``` ``` [1] "cat" "cat" "cat" "cat" ``` -- `rep(`what you want to repeat`, `number of times to repeat it`)` --- # `rep()` What's easier to code? ```r pets <- c("cat", "cat", "cat", "cat", "dog", "dog", "dog", "dog", "dog") pets ``` ``` [1] "cat" "cat" "cat" "cat" "dog" "dog" "dog" "dog" "dog" ``` ```r pets2 <- c(rep("cat", 4), rep("dog", 5)) pets2 ``` ``` [1] "cat" "cat" "cat" "cat" "dog" "dog" "dog" "dog" "dog" ``` --- # Functions in Functions Arguments to functions can be functions! This is called **nesting**. .pull-left[ ```r table( c( rep("heads", 5000), rep("tails", 5000) ) ) ``` ``` heads tails 5000 5000 ``` ] .pull-right[ .center[  ] ] -- **WATCH OUT FOR PARENTHESES** --- # Remember `sample()`? We used `sample()` to simulate rolling a die using the vector `1:6`. We can also give `sample()` a character vector to sample from! ```r coin <- c('heads', 'tails') sample(coin, size = 30, replace = TRUE) ``` ``` [1] "heads" "heads" "heads" "heads" "tails" "heads" "tails" "tails" "tails" [10] "heads" "heads" "tails" "tails" "tails" "tails" "heads" "heads" "heads" [19] "heads" "heads" "tails" "tails" "heads" "heads" "heads" "tails" "tails" [28] "tails" "tails" "tails" ``` --- # The `prob` argument to `sample()` We can simulate a *biased* coin using the `prob` argument. - `prob` takes a vector of "probability weights", one per element of the vector to sample from - `prob` applies the weights *in order* ```r coin <- c('heads', 'tails') sample(coin, size = 30, replace = TRUE, prob = c(0.3, 0.7)) ``` ``` [1] "heads" "tails" "tails" "tails" "heads" "tails" "tails" "tails" "tails" [10] "tails" "heads" "tails" "tails" "tails" "heads" "heads" "tails" "tails" [19] "tails" "tails" "tails" "tails" "heads" "heads" "tails" "tails" "tails" [28] "tails" "tails" "tails" ``` --- # Pseudo-random numbers .pull-left[ - Humans are very bad at generating random numbers. - Computers only **seem** better. - Computers produce *pseudo-random* numbers: if you know the "seed", you know the entire sequence of "random" numbers. ] .pull-right[  ] --- # `set.seed()` - We can tell R to use a particular "seed" with `set.seed()`. - Setting the seed makes your randomness **reproducible**: you will now get the same answers (in your knitted document) as your peers, provided you use the same code. ```r set.seed(8362) sample(1:5000, size = 3) ``` ``` [1] 258 1834 2371 ``` --- # Line Graphs 📈 .pull-left[ Remember this? ```r sixSidedDieRoll <- function(n) { mean(sample(1:6, size = n, replace = T)) } plot(sapply(1:300, sixSidedDieRoll), main = "Law of Large Numbers Example", xlab = "Number of Six-Sided Dice", ylab = "Average") ``` ] .pull-right[  ] --- # Line Graphs 📈 .pull-left[ We can make a line graph with the `type` argument to `plot()`: ```r plot(sapply(1:300, sixSidedDieRoll), main = "Law of Large Numbers Example", xlab = "Number of Six-Sided Dice", ylab = "Average", * type = "l") ``` Use `type = l` for a `l`ine graph (that's a **lowercase L**) ] .pull-right[  ] --- # Line Graphs 📈 .pull-left[ ```r plot(sapply(1:300, sixSidedDieRoll), main = "Law of Large Numbers Example", xlab = "Number of Six-Sided Dice", ylab = "Average", * type = "o", pch = 20) ``` Use `type = o` to draw lines between points (and `pch` is back!) ] .pull-right[  ] --- # Line Graphs 📈 .pull-left[ ```r plot(sapply(1:300, sixSidedDieRoll), main = "Law of Large Numbers Example", xlab = "Number of Six-Sided Dice", ylab = "Average", type = "o", pch = 20, * lty = "dotted", * lwd = 2) ``` - Use `lty` to specify `l`ine `ty`pe: (0=blank, 1=solid (default), 2=dashed, 3=dotted, 4=dotdash, 5=longdash, 6=twodash) - Use `lwd` to specify `l`ine `w`i`d`th (default is 1) ] .pull-right[  ] --- # Lab Project ⌨️ .pull-left[ ### Your tasks - Complete the "Try It!" and "Dive Deeper" portions of the lab assignment by copy/pasting and modifying appropriate code from earlier in the document. ] .pull-right[ ### How to get help - Use the "labs" section of Piazza to ask questions and work with your peers. - If you use Piazza, please note that in the "Collaborators" list at the top of the discussion section. - If you're really stuck, email your lab instructor! ] --- class: center middle <img src="https://media.tenor.com/images/2ae8de10391445da74ab02f5ab4f4ab7/tenor.gif" height=500 />